A Course Map Where the Arrows Have to Explain Themselves

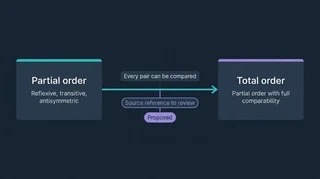 Illustration: the assumption belongs on the connection.
Putting two ideas next to each other on a map says they are related. It does not explain what connects them. My Concept Graph asks more of an arrow: what claim is it making, which assumption does it need, and where in the course material can I check it?
The package’s sample graph gives a compact example. A partial order can leave some pairs of items unranked relative to one another. Requiring every pair to be comparable gives a total order. Writing that condition on the connection makes the change visible. It is the kind of detail that can disappear when a map is just a collection of terms joined by lines.
By the October 15 checkpoint, the course graph contained 104 concepts and 159 connections across eight sections of graduate microeconomics. Selecting a concept opens its explanation and mathematical statement; selecting a connection exposes the claim and its conditions. Section filters and alternative layouts help narrow the view when the whole map becomes crowded. The counts describe its scale, not how much of the course I have mastered.
The map grows out of the same foundation as the study guides: converted textbooks, lecture notes, assignments, and passages found through the Source Indexer. A guide develops an explanation in sequence. The graph gives me another way to explore the material by following what an idea depends on and what it helps establish. They are separate uses of the collection; generating one does not automatically create the other.
There is also a useful division of labor behind the graph. Code prepares task cards containing source passages. Gemini in Antigravity drafts the explanations and connections, and a submission step checks their structure and references before adding them. The new material stays marked as proposed until a person reviews it. This separates a model’s fluent suggestion from an accepted part of the map.
Those checks have limits. A reference can point to a real passage while the explanation misreads it. The drafting model also critiques its own connections, which makes its generous verdicts worth questioning. Section summaries remain drafts, and the GitHub route for submitting reviewer proposals had not yet been exercised from start to finish at this checkpoint.
What makes the graph promising is the opportunity to ask a precise question at a confusing junction. If I cannot follow an arrow, I can examine the claim, the assumption, and the passage behind it. That gives me a concrete starting point for studying—or for correcting the map itself.
Retrospective account prepared October 16, 2026, covering the October 15 checkpoint. The status snapshot records the counts and open checks. The live graph and project pages may have changed since.
