Novel Omnibus Normality Test
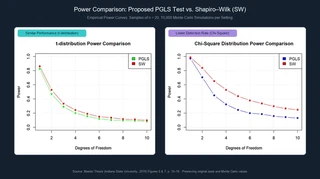 Original thesis figures compare the proposed PGLS test with Shapiro–Wilk for samples of 20 observations and 10,000 simulations per setting.
My mathematics thesis explored a way to test whether data depart from a bell-shaped, or normal, distribution. It transforms an ordered sample into a pattern of departures from what normal data would produce, then looks for structure beyond random fluctuation. The aim was to detect different kinds of departure through one flexible test.
In the small-sample simulations, the method performed similarly to the established Shapiro–Wilk test for two families of distributions, but fell behind for two others. The result was a proof of concept with room to investigate the construction further. It did not establish a generally stronger normality test.
Turning a sample into a pattern
An ordered sample contains information about where it departs from the expected shape. After the transformation, normal samples fluctuate around zero. Other distributions can produce a systematic bend or a different pattern of departures. Keeping their direction as well as their size is the useful part of the approach.
I fitted those departures with a penalized generalized least squares model, or PGLS. The penalty discourages the model from simply tracing every noisy point, much as smoothing a jagged line can reveal its broader shape. The model also accounts for how the transformed observations vary together. Its fitted coefficients supply a measure of departure, and simulations of normal samples establish a rejection threshold.
What the simulations showed
The comparison used samples of 20 observations and 10,000 simulations per tested setting. Power is the proportion of non-normal samples a test correctly identifies under those conditions.
| Simulated distribution | Proposed test compared with Shapiro–Wilk |
|---|---|
| t-distribution | Similar, generally slightly lower power |
| Generalized Pareto | Similar patterns across the tested shape settings |
| Gamma | Lower power, by about 10–20 percentage points in the reported comparisons |
| Chi-square | A larger gap, favoring Shapiro–Wilk over most tested settings |
As distributions became harder to distinguish from normal, detection became difficult for both methods. The thesis results and conclusion describe these conditions and the remaining choices: how strongly to smooth, which patterns to fit, and how to construct the final statistic.
This was my master’s thesis at Indiana State University, advised by Dr. Mark Inlow. The repository includes the report and R implementation.
