Predicting Wheat Yields in New Environments
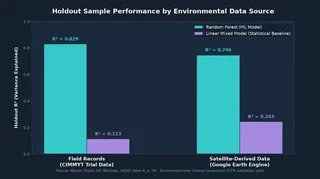 Thesis Table 6 compares holdout results across two models and two environmental data sources.
Choosing a wheat variety is partly a question of where it will grow. My master’s thesis tested whether satellite measurements of the environment and accessible machine learning tools could help predict yields where field-trial information is limited. I compared those measurements with field records, using wheat trials from CIMMYT, an international crop-research organization.
The results separated two questions that can easily get mixed together. Machine learning models outperformed the study’s linear mixed-model baseline on held-out observations. Satellite data helped that baseline, but the machine learning models performed better with the manually collected environmental data. A stronger model and a more accessible data source did not automatically make the best combination.
What was compared
Google Earth Engine supplied environmental measurements such as soil moisture, precipitation, and vapor pressure. Field records supplied another view of growing conditions and management. I also tested adding pedigree information describing relationships between wheat varieties.
Four approaches predicted yields: a Bayesian linear mixed model, random forest, gradient boosting, and a neural network. Fifteen percent of observations were held out for the final comparison, with varieties represented across that sample. This tests predictions within the study’s data; use in new regions would need further validation.
For a direct comparison using environmental data alone:
| Environmental information | Random forest R² | Linear mixed-model R² |
|---|---|---|
| Field records | 0.829 | 0.113 |
| Satellite-derived data | 0.746 | 0.243 |
R² measures how much of the variation in the held-out yields the predictions account for relative to predicting the average. It is not the percentage accuracy of an individual yield prediction. The thesis, Table 6 gives the full comparison, including pedigree information.
Accessibility mattered too
The machine learning models ran on freely available Google Colab resources, though some calculations took hours. The mixed model’s large genetic covariance matrices required a specialized machine with roughly a terabyte of memory. Computing requirements were therefore part of the comparison, alongside prediction quality.
The code is public, but restricted pedigree data prevents full reproduction from public inputs alone. The project is a research proof of concept, with further work needed on location precision, model settings, and validation before using its predictions to make planting decisions.
This was my Spring 2020 thesis for UC Berkeley’s Master of Development Practice, advised by Professor David Zilberman. The repository contains the code and full report.
