Visualization Sub-Agent
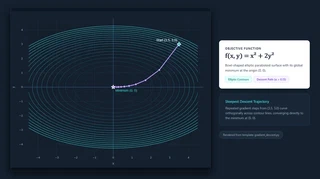 Illustration: Inspect the steps as they approach the minimum.
A formula for gradient descent describes repeated steps toward a minimum. A picture can show what those steps do: the prepared example in this tool traces a path across the contours of a bowl-shaped surface toward its center. I can zoom in and inspect the points alongside the written explanation, rather than infer the whole path from the update rule.
The important distinction is how that picture is made. A small library covers familiar concepts with prepared Plotly charts, which run without a chart-generation model call. For other topics, the tool asks a model to write chart code using the question and retrieved course passages. That opens up more concepts, but introduces another judgment: a script can run successfully while illustrating the wrong idea.
A plot beside the answer
Visualization is optional within RAG Analysis. A report can combine the question, answer, source references, and interactive chart in one HTML file. If chart generation fails, the text report can still be produced. A recorded September 6, 2026 trial combined a generated practice problem, its solution, and an embedded interactive plot in the same report.
Generated charts currently use Gemini by default, with API cost. Local Ollama generation is an explicit alternative, but it timed out or produced broken scripts in the recorded comparison. Gemini succeeded twice on the same request. Two successes are useful evidence for that change of default, not a broad chart-accuracy evaluation.
Running code is one check
The tool executes generated code with a time limit, a separate working directory, and an environment that excludes inherited API secrets. Execution errors can be returned to the model for a bounded retry. These measures limit particular failure modes; the process is not a comprehensive security sandbox.
Past scripts that ran successfully can be offered as examples to later generation. They stay separate from the prepared templates because successful execution alone does not make an example mathematically correct. Whether that small example store improves results over sustained use remains unmeasured.
Template matching also needs care: “convergence in probability” should not receive a generic series-convergence plot just because both contain the same word. Inspecting what the chart represents remains part of using it. The README explains templates, generation, and the execution limits.
