Compound Shocks Panel
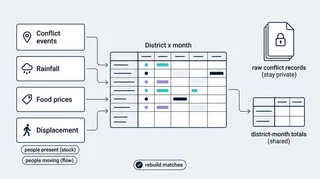 Illustration: Four separate sources are lined up into one district-by-month table, with the restricted raw conflict records kept out of what is shared.
In places like Somalia and Sudan, a household rarely faces one shock at a time. Fighting, a failed rainy season, and a spike in grain prices can arrive together, and displacement often follows. Most data sources describe only one of these, and each is built differently: different place names, different time steps, different units, and different rules for reuse. This project builds one monthly record per district that holds all of them, and keeps the work open to checking at every step.
The problem
Studying compound shocks needs the sources to line up. That is where quiet mistakes enter: a district spelled two ways, one conflict event counted once per actor involved, a count of people present treated as if it were a count of people moving. Humanitarian early-warning work can only be as good as the table underneath it, and a reader should be able to rebuild that table and get the same numbers.
My motivation is research on how overlapping shocks relate to displacement, but the first step is infrastructure: a panel I can defend line by line before I ask any question of it.
What I built
A district-month panel for two countries. Somalia (74 districts) and Sudan (189 localities) from January 2021 to October 2025, 58 months each. Each row is one place in one month, with:
- conflict events and reported fatalities (ACLED);
- monthly rainfall from satellite estimates (CHIRPS);
- sorghum and wheat prices (WFP market monitoring);
- displacement: movements in Somalia (UNHCR/NRC PRMN, through August 2023) and numbers of displaced people present in Sudan (IOM DTM).
Decisions written down, not buried in code.
- Every source has a descriptor listing the provider, what each variable means and its unit, the place and time it covers, how access works, its reuse terms, and how far it has been verified.
- Counts of people present (a stock) and counts of people moving (a flow) stay in separate columns. They answer different questions and are not combined.
- Where a figure is missing, it stays missing. It is never filled with zero, because “no report” and “no events” are different facts.
Safeguards for restricted data. The conflict data come from an account-based service; the project keeps raw event records out of version control and marks only district-month conflict totals for sharing. Each check on those files reports counts and checksums, never records. Reuse terms differ by source; the repository records them and does not redistribute the downloads.
One command to fetch, one to rebuild. fetch downloads the sources (the conflict data through the provider’s API when an account is available) and records a checksum for each file. reproduce rebuilds the panel, an audit memo with a missing-data picture, and the figures, skipping steps whose inputs have not changed. Each run writes a plain-language summary of what it made and how long it took.
The project uses my reprokit framework for the descriptors, checks, and run summaries.
How well it works so far
- It rebuilds identically. On 2026-11-06 I rebuilt both panels from the raw downloads and every checksum for the panel and the publishable totals matched the earlier recorded run. Somalia takes about 4 minutes and Sudan about 14, and roughly 90% of that is reading the rainfall rasters.
- The automatic download matches the manual one. The API download of the conflict data contained exactly the same set of events as my earlier manual export, for both countries, and the Somalia panel built from it was byte-identical.
- Tested on two operating systems. The 199 automated tests pass, and continuous integration runs on both Linux and Windows. Windows caught a real problem: Git was rewriting line endings in test files and silently changing their checksums. A repository setting now prevents that, and a test fails if it recurs.
- Documented limits. Somalia’s displacement series ends in August 2023, so later months have none. Sudan’s displacement figures are stocks, not flows, and the Sudan population file covers 188 of the 189 localities. The panel records these gaps instead of hiding them.
What it does not do yet: it contains no findings. I have built the data, not drawn conclusions from it.
What comes next
- Close the known gaps. Review the missing population estimate for one Sudan locality, and move the remaining source descriptors to the newer, stricter format.
- Add richer sources. DTM household needs assessments for Sudan (food consumption, hunger measures, reasons for displacement); cross-border and refugee movement data; and, later, satellite-derived indicators from Google Earth Engine.
- Define the questions in advance. Write down the compound-shock definitions and the checks before looking at any outcome, and have the data and definitions reviewed before the first analysis.
- Test the template on other places. The same structure should carry to other country pairs, so the next step is trying it on a new place.
