Concept Graph
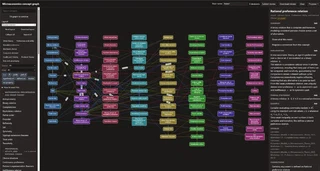 Screenshot of the interactive Microeconomics concept graph interface, showing concept nodes, connections, and the details panel for a selected concept.
Concept Graph maps the ideas in a course and the conditions that connect them. An arrow can say that one idea implies another, but it also records the assumption needed to make that claim. Selecting it gives me a sentence to examine and references to the course material behind it.
For example, the package’s sample graph connects a partial order to a total order when every pair can be compared. A partial order can leave two items unranked relative to one another; adding that comparison requirement produces a total order. The condition on the arrow explains what changed, rather than leaving me to infer it from two nearby boxes.
The first full graph covers the first half of a graduate microeconomic theory sequence: open the live microeconomics graph. As of October 15, 2026, it contains 104 concepts and 159 connections across eight course sections. A second graph now covers a graduate econometrics course: open the live econometrics graph. Completed on October 21, 2026, it contains 112 concepts and 135 connections across eight course sections, all awaiting the owner’s review. Those counts describe each draft’s scale; every concept and connection remains marked as proposed until reviewed.
Following an idea
Each box represents an idea, such as a definition, theorem, or example. Selecting it opens an explanation, its mathematical statement, and its connections written out in words. Course-section filters and several layouts help narrow a crowded graph to the part I want to study.
That makes the graph useful for tracing a result back through the assumptions and definitions it depends on. Section summaries offer another way in, though those summaries are AI drafts and some wording is looser than the underlying theory.
Building and reviewing the connections
An AI agent drafts explanations and connections from task cards containing passages found through the Source Indexer. The transcription and textbook conversion tools prepare the notes, slides, assignments, and books it searches. Code then checks the submitted structure: references must come from the supplied passages, required conditions must be present, and circular definition chains are rejected. A cited passage can still be misinterpreted.
The same collection supports the Study Guide Pipeline. A guide develops a topic through explanations and examples; the graph exposes the relationships and assumptions between ideas. They have separate drafting workflows, so building one does not automatically produce the other.
The drafts remain marked as proposed until a person accepts or edits them. Reviewers can comment, reject a connection, or suggest a missing idea through the page. Suggestions from several reviewers are combined before the maintainer handles them. Submission through GitHub has not yet been tested from start to finish.
What a second course taught
Applying the drafting pipeline to econometrics revealed where a data-driven statistics course differs from a theory course:
- Checking against the syllabus: Initial drafting from lecture notes and textbook passages missed 21 key concepts, including an entire syllabus topic on dynamic causal effects. Adding an explicit gap check that compares the course syllabus against the drafted concept list caught those omissions before review.
- Specialized connection types: The original vocabulary grouped too many relationships into generic categories. Econometrics required two new connection types—one (
defined_via) for concepts formally defined in terms of other concepts, and another (assumption_of) to separate the conditions an empirical estimator requires from the mathematical premises of a theorem. - Rotating agent roles: To prevent a model from approving its own blind spots, the pipeline rotates responsibilities: Gemini drafts nodes and connections from source passages, Codex evaluates whether each proposed link is supported or weak, and Claude reviews vocabulary additions and structural repairs. The agent that drafted or corrected an item no longer critiques it.
- Separating source data from publication: The graph’s source data and review history stay in a private repository, and only the built interactive page is published to a public site.
Evidence and limits
The October 15 status records 331 Python tests, 45 viewer tests, browser checks, and a graph built from actual course materials. These establish different things: the tests exercise the software, while the graph shows what the drafting process produced. Neither establishes a learning benefit.
For the microeconomics graph, connections were drafted and critiqued by the same model, and that critic approved almost every connection (154 of 155), so its review may be lenient. The econometrics graph used a separate critic, but no model replaces subject-matter judgment: every item in both graphs remains proposed until a person reviews it. The current status records the open issues; the README explains how the graph is built and reviewed.
